Template · Google Sheets + Excel
Expense & Profit Tracker
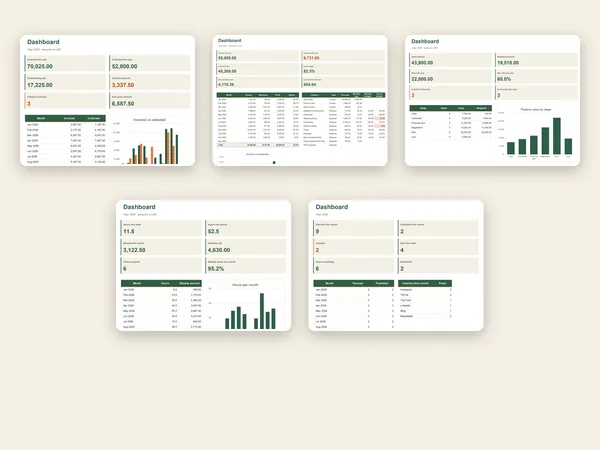
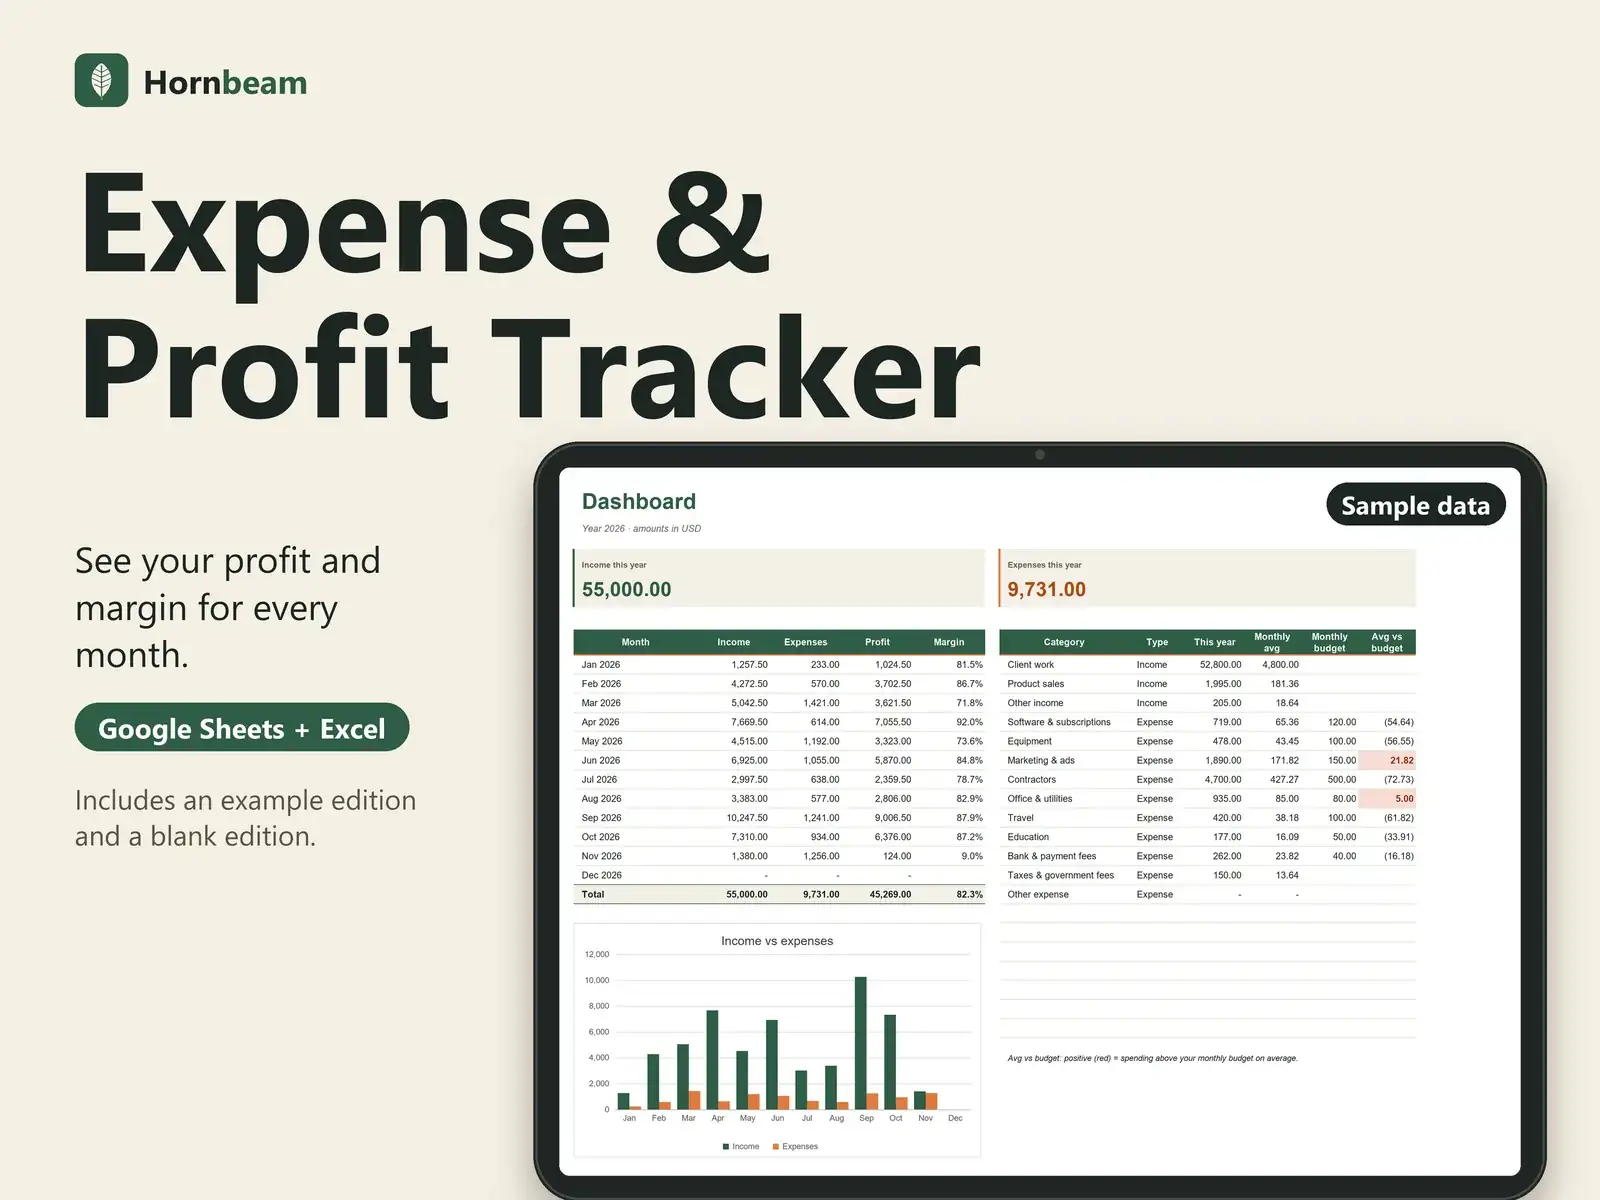
Log income and expenses; the dashboard does the math: profit and margin for every month, plus budget vs actual per category.
One-time payment. Checkout and receipt by Polar. You receive the files straight after checkout.
- Example edition and blank edition
- One-time payment, no subscription
- Google Sheets and Excel 2016+
Tour
See it in 15 seconds
A silent 15-second walkthrough, recorded from the real file with sample data.
Features
What it does
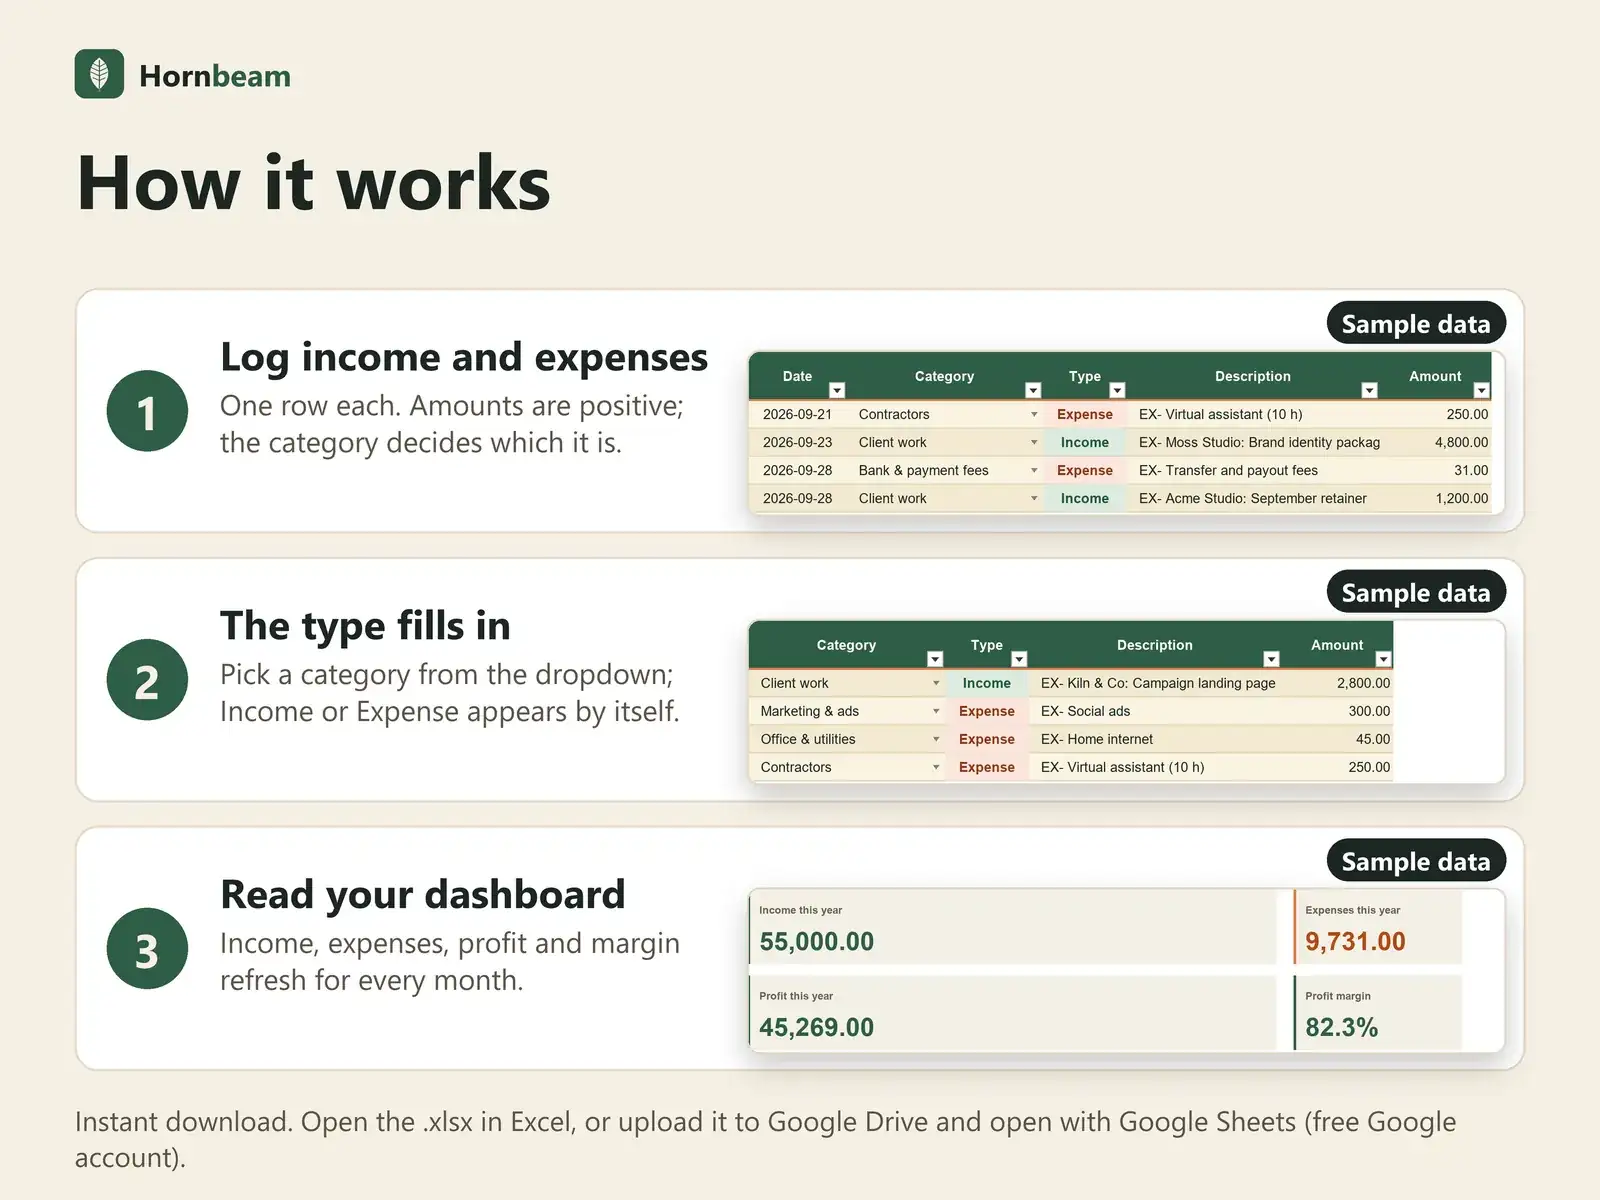
Income and expenses, one row each
Amounts are positive; the category decides which it is.
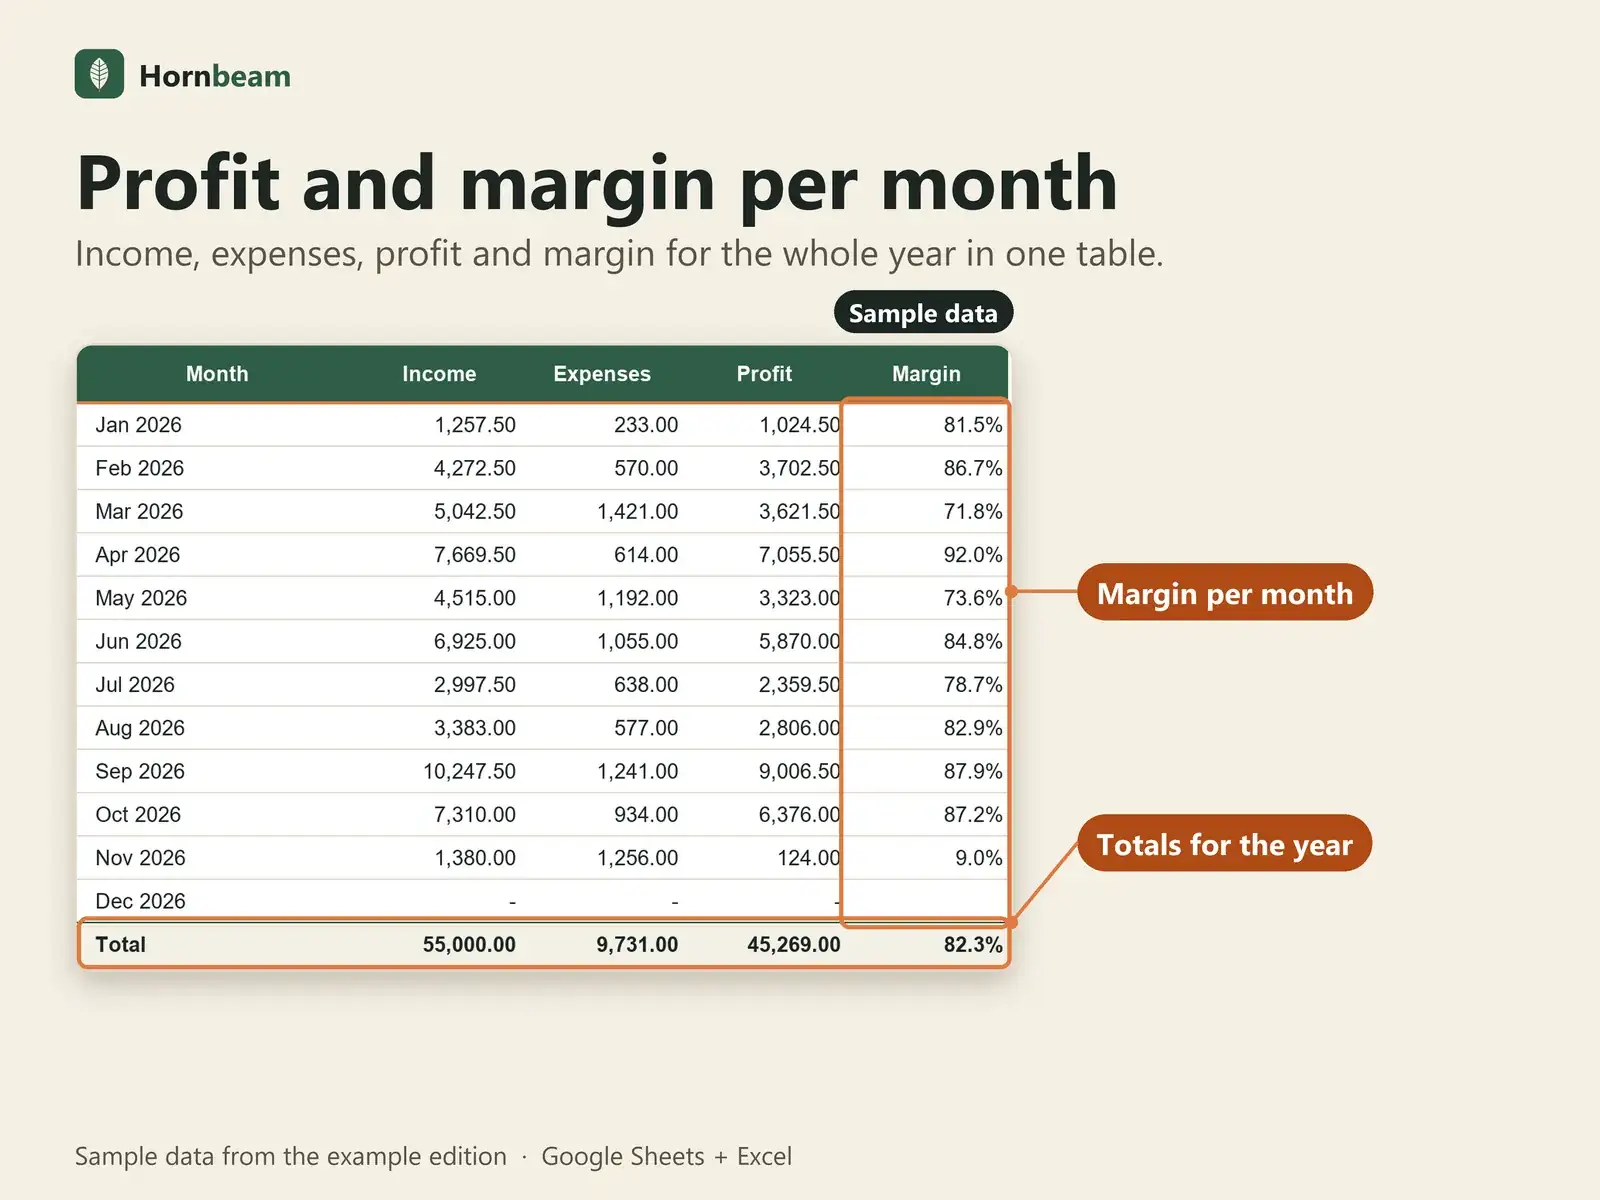
Profit and margin
Income, expenses, profit and margin for each month and for the year.
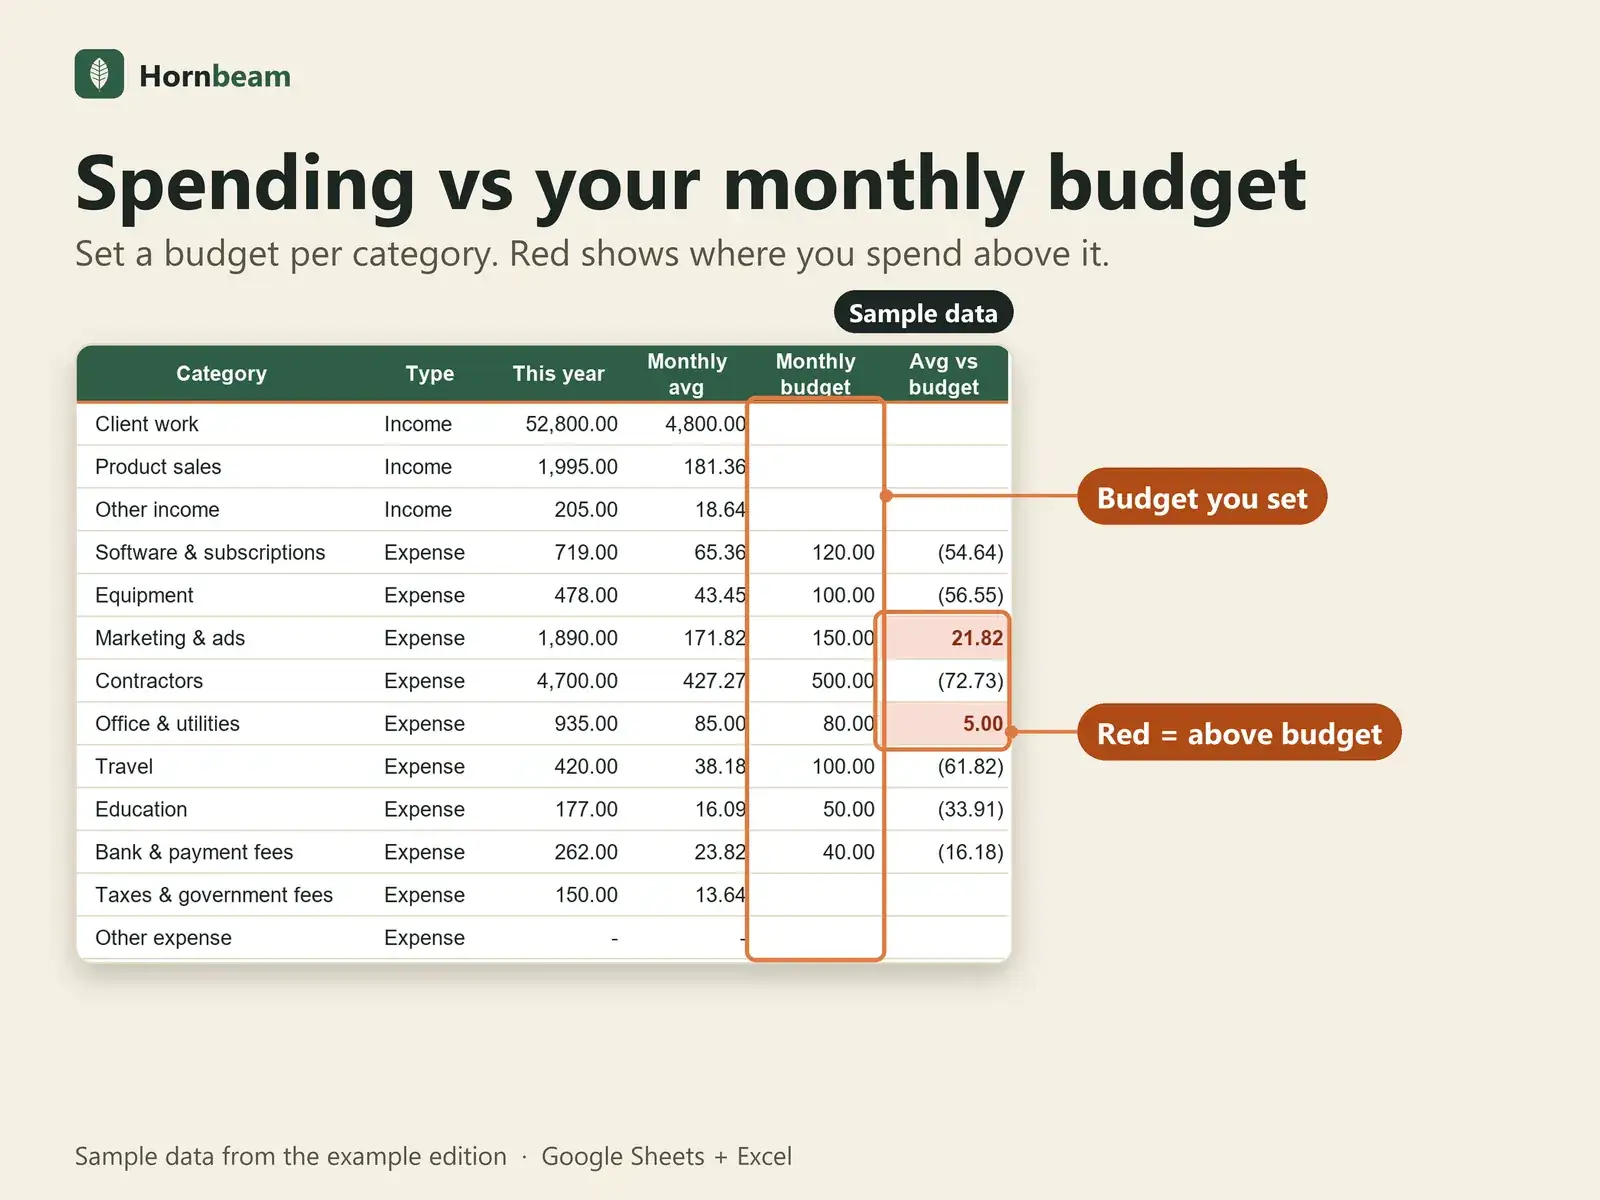
Budget vs actual
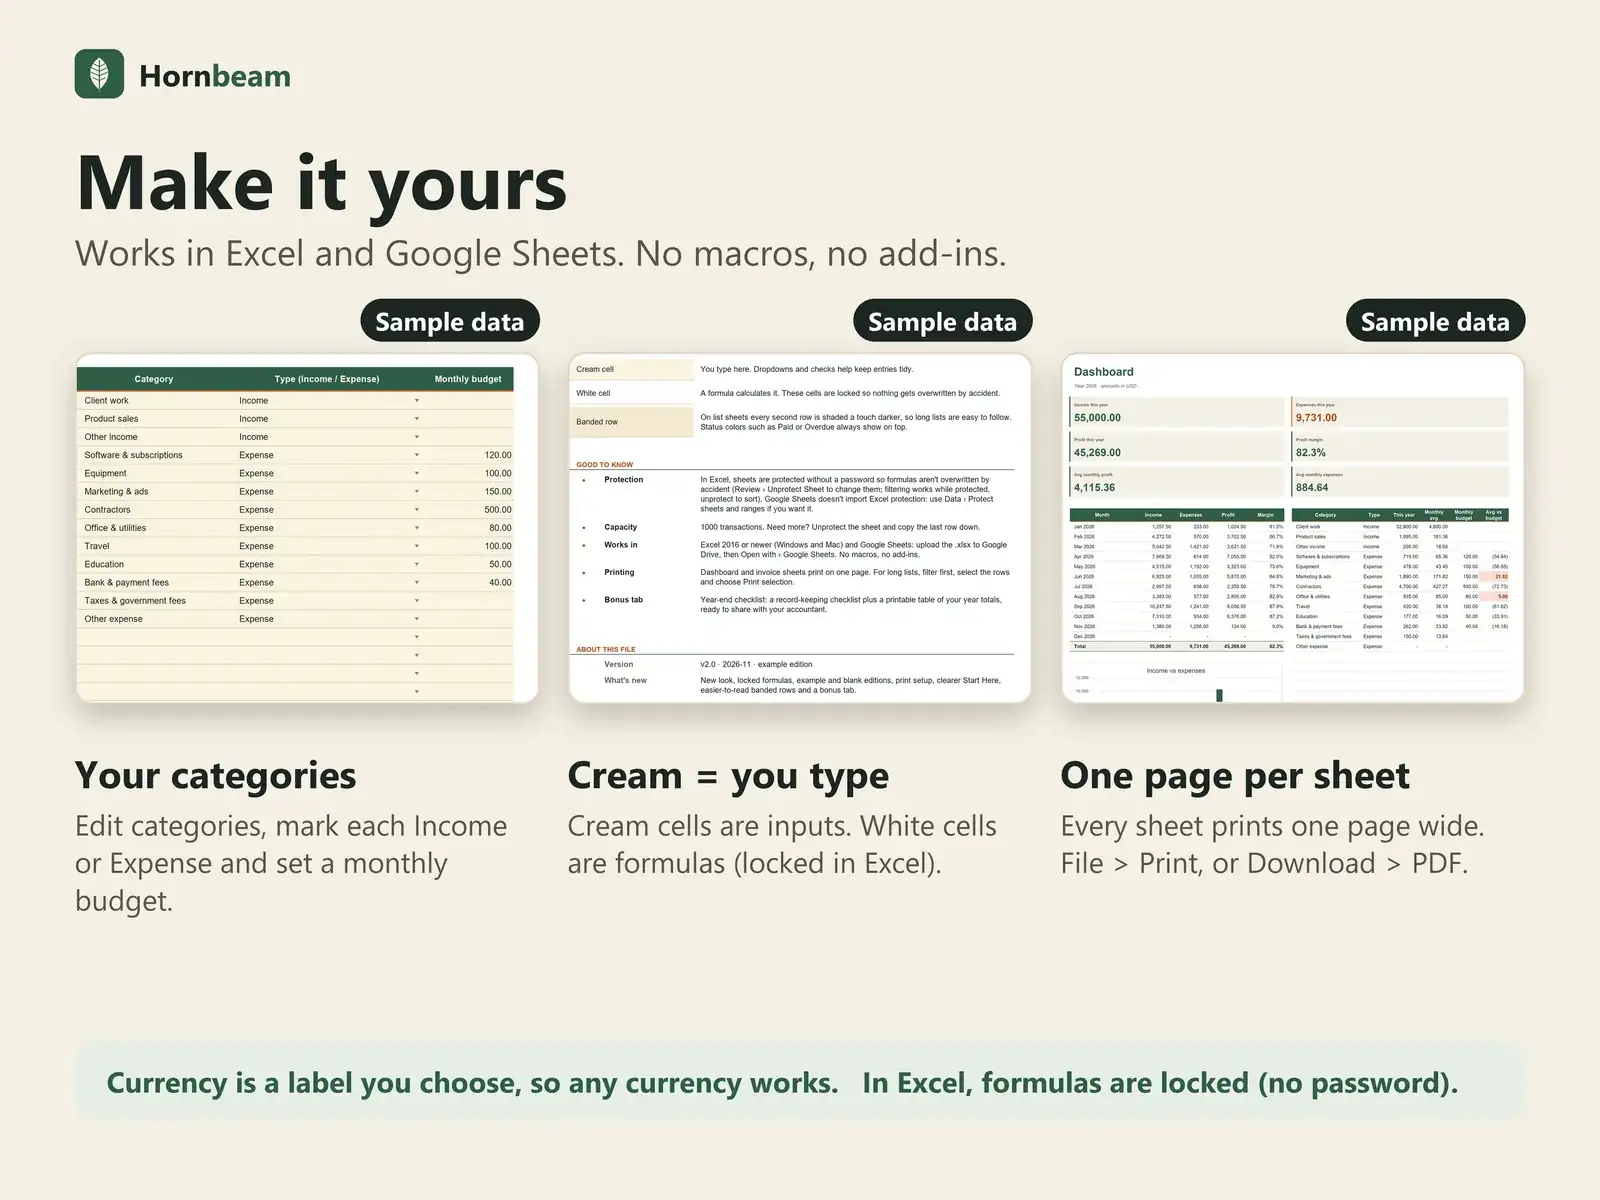
Set a monthly budget per category; red marks where you spend above it.
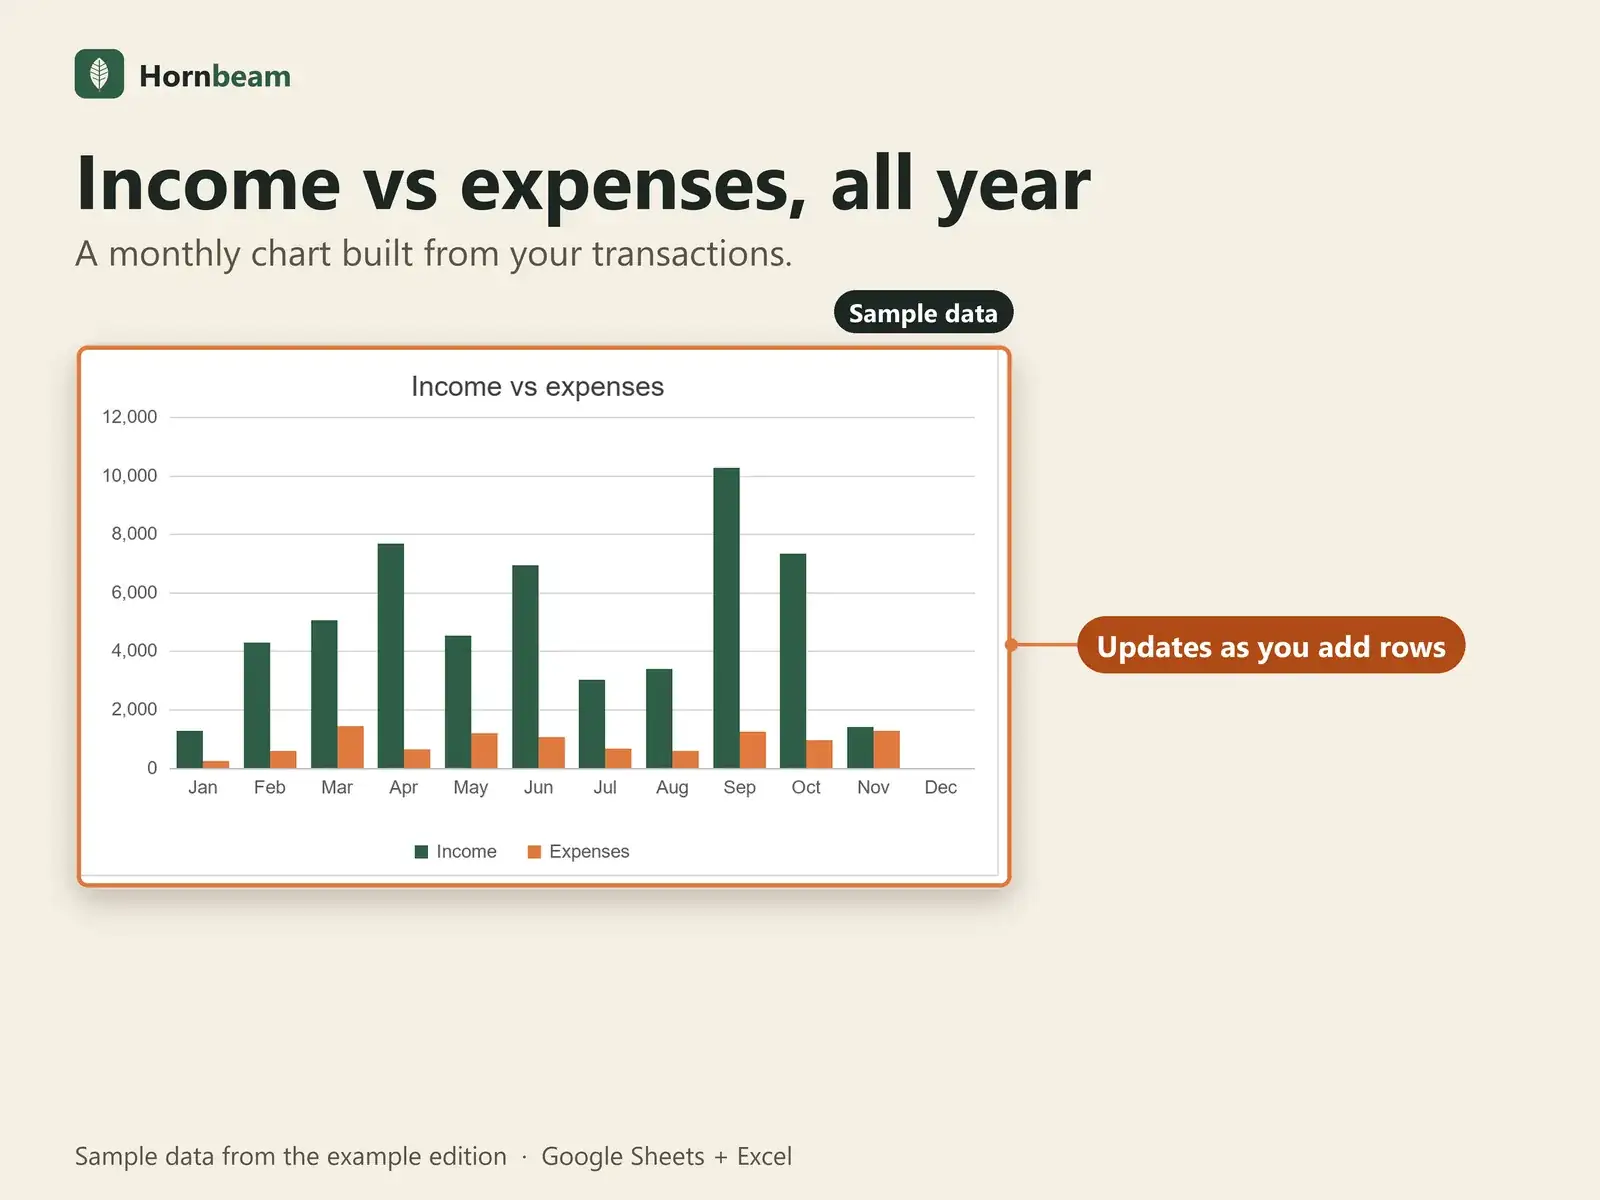
Chart
Income vs expenses by month, built from your rows.
Your own categories
Up to 20 categories with optional budgets, plus your own payment methods.
Year-end checklist
Bonus tab with a checklist and printable year totals.
What is included
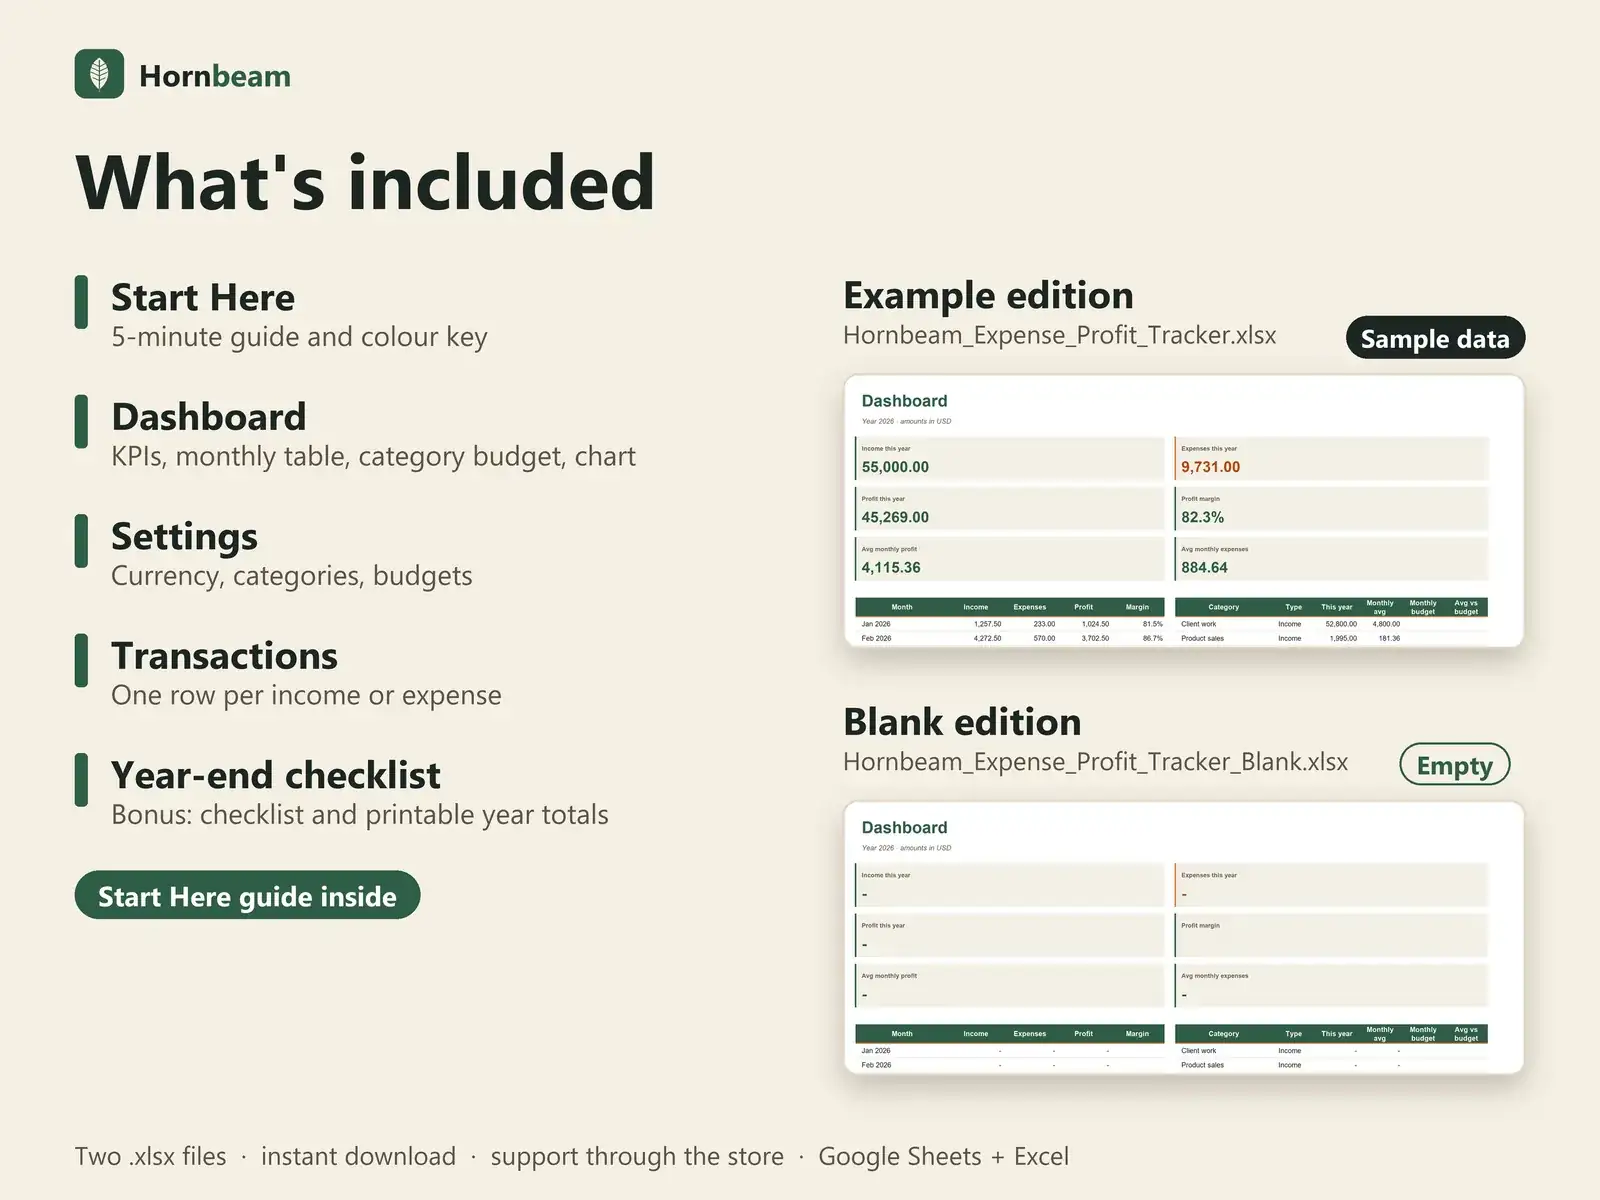
Two editions, one set of tabs
You get two .xlsx files with identical formulas, charts and layout. Open the example edition to explore, or the blank edition to start clean.
Example edition
Filled with sample data (rows marked EX-) so you can see every dashboard and flag working. Delete the EX- rows or switch to the blank edition when you are ready.
Blank edition
The same file, empty and ready for your own data. Capacity: 1,000 transactions per file. Copy the last row down if you need more.
| Tab | What it is for |
|---|---|
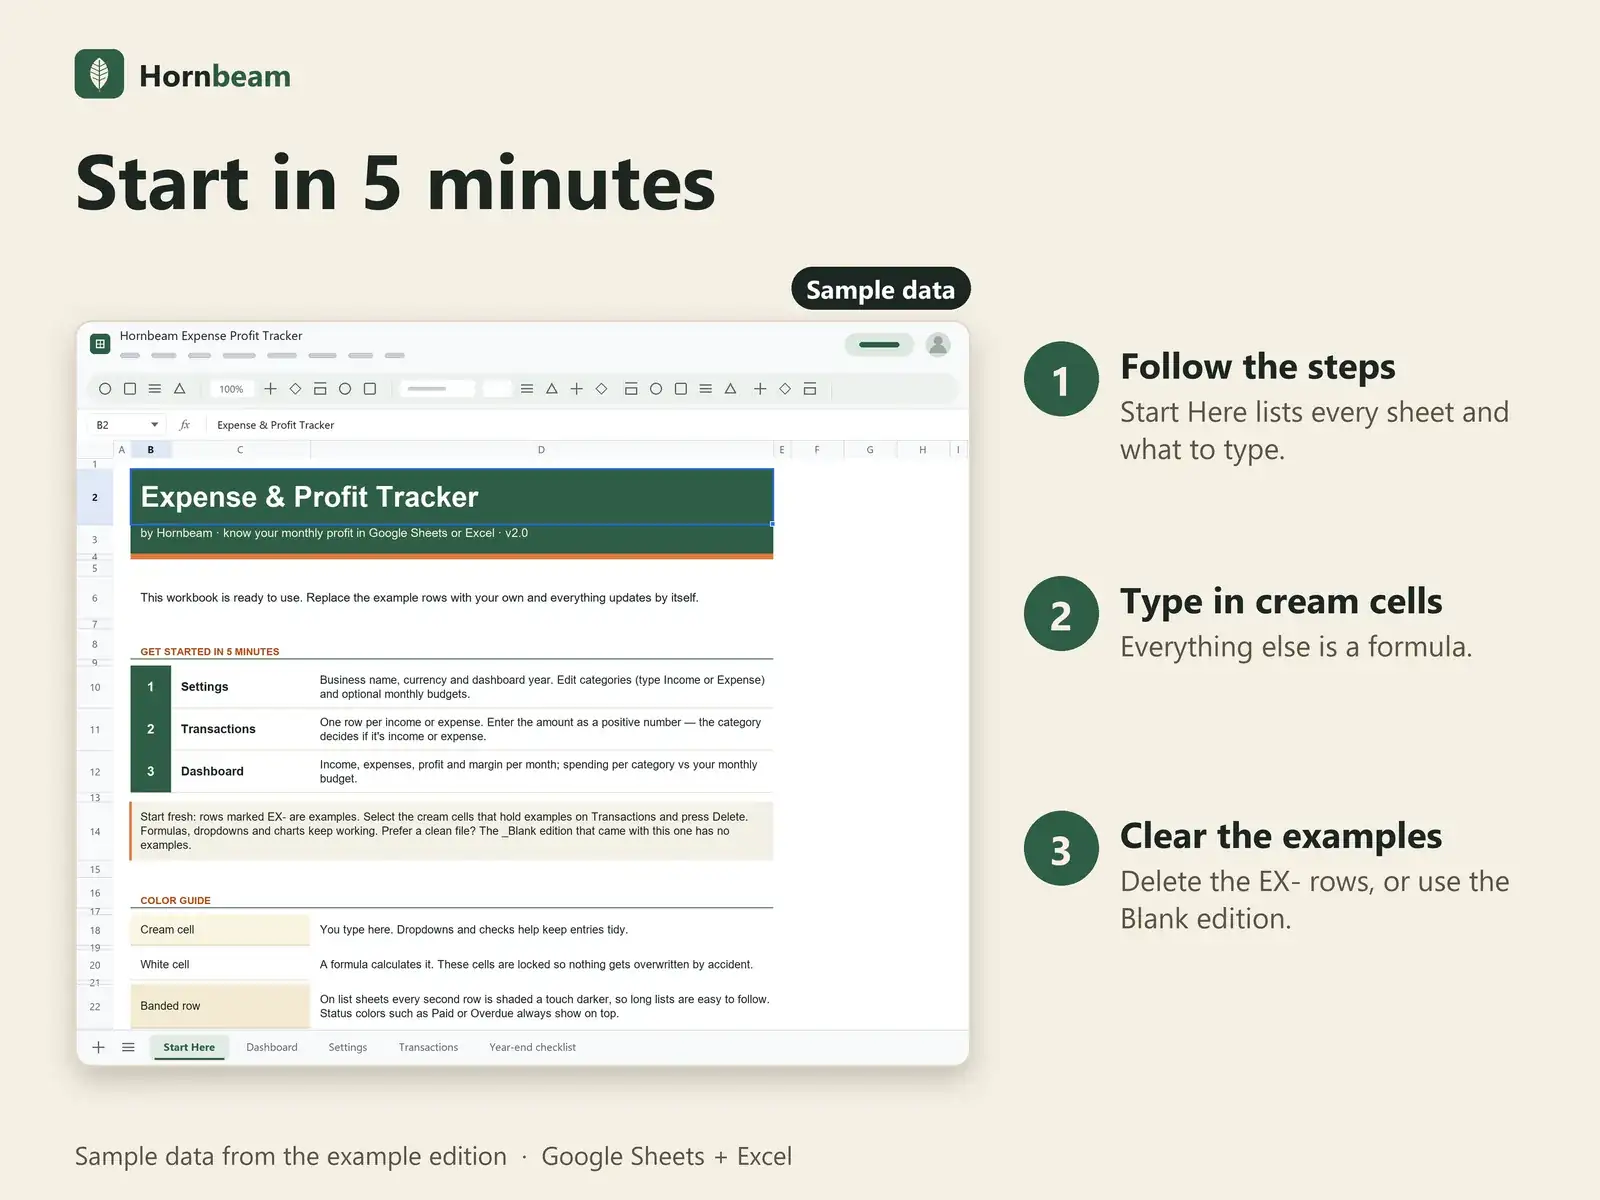
| Start Here | 5-minute guide and colour key |
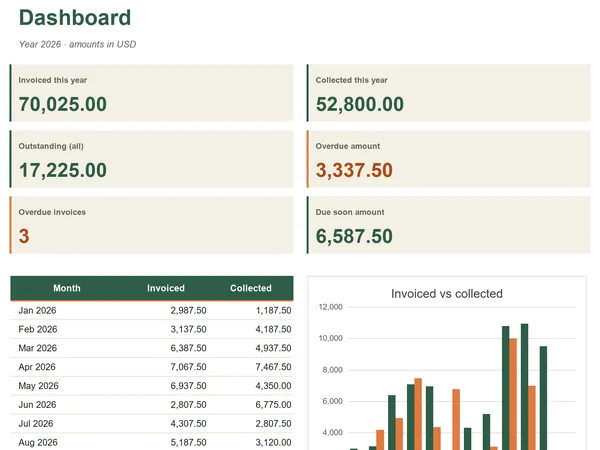
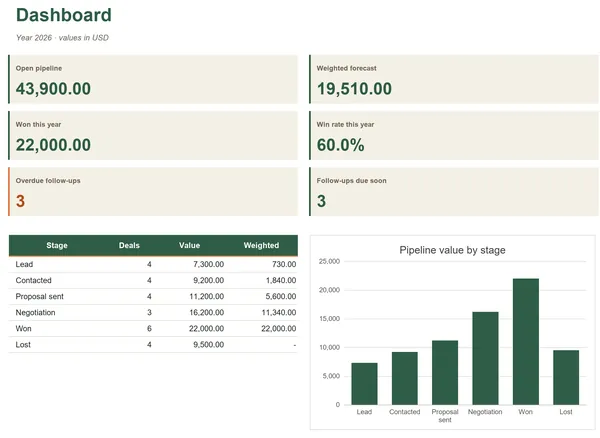
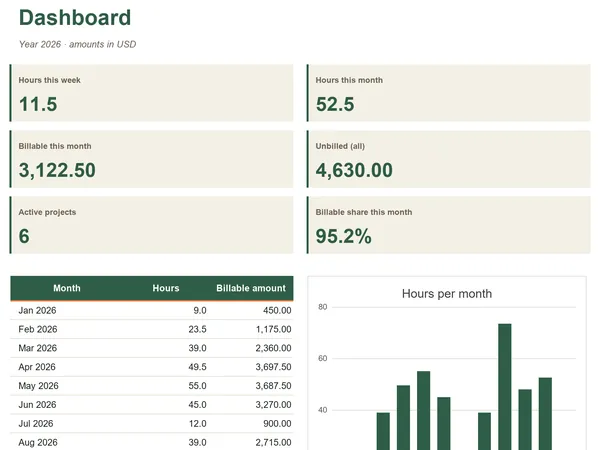
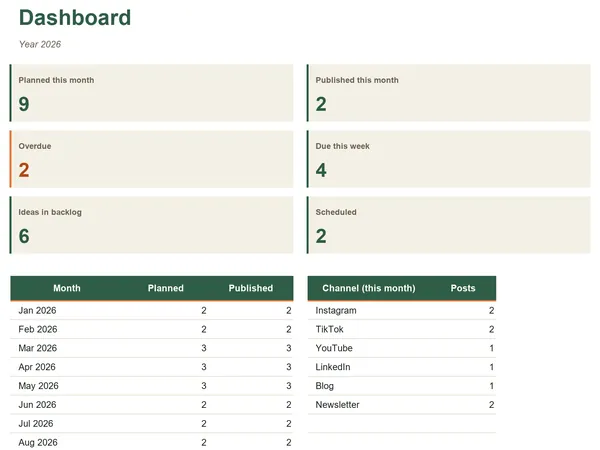
| Dashboard | KPIs, monthly table, category budget, chart |
| Settings | Currency, categories, budgets |
| Transactions | One row per income or expense |
| Year-end checklist Bonus | Checklist and printable year totals |
A tracking tool, not accounting software. Keep official records as your local rules require.
Compatibility
Works where you already work
| App | Support |
|---|---|
| Google Sheets | Yes. Upload the .xlsx to Google Drive, then right-click and choose Open with Google Sheets. A free Google account is enough. |
| Microsoft Excel | Excel 2016 or later opens the .xlsx directly. |
| Macros and add-ons | None. Plain formulas, dropdowns and charts. |
| Other apps | Numbers, LibreOffice and similar apps are not officially supported. |
FAQ
Questions about Expense & Profit Tracker
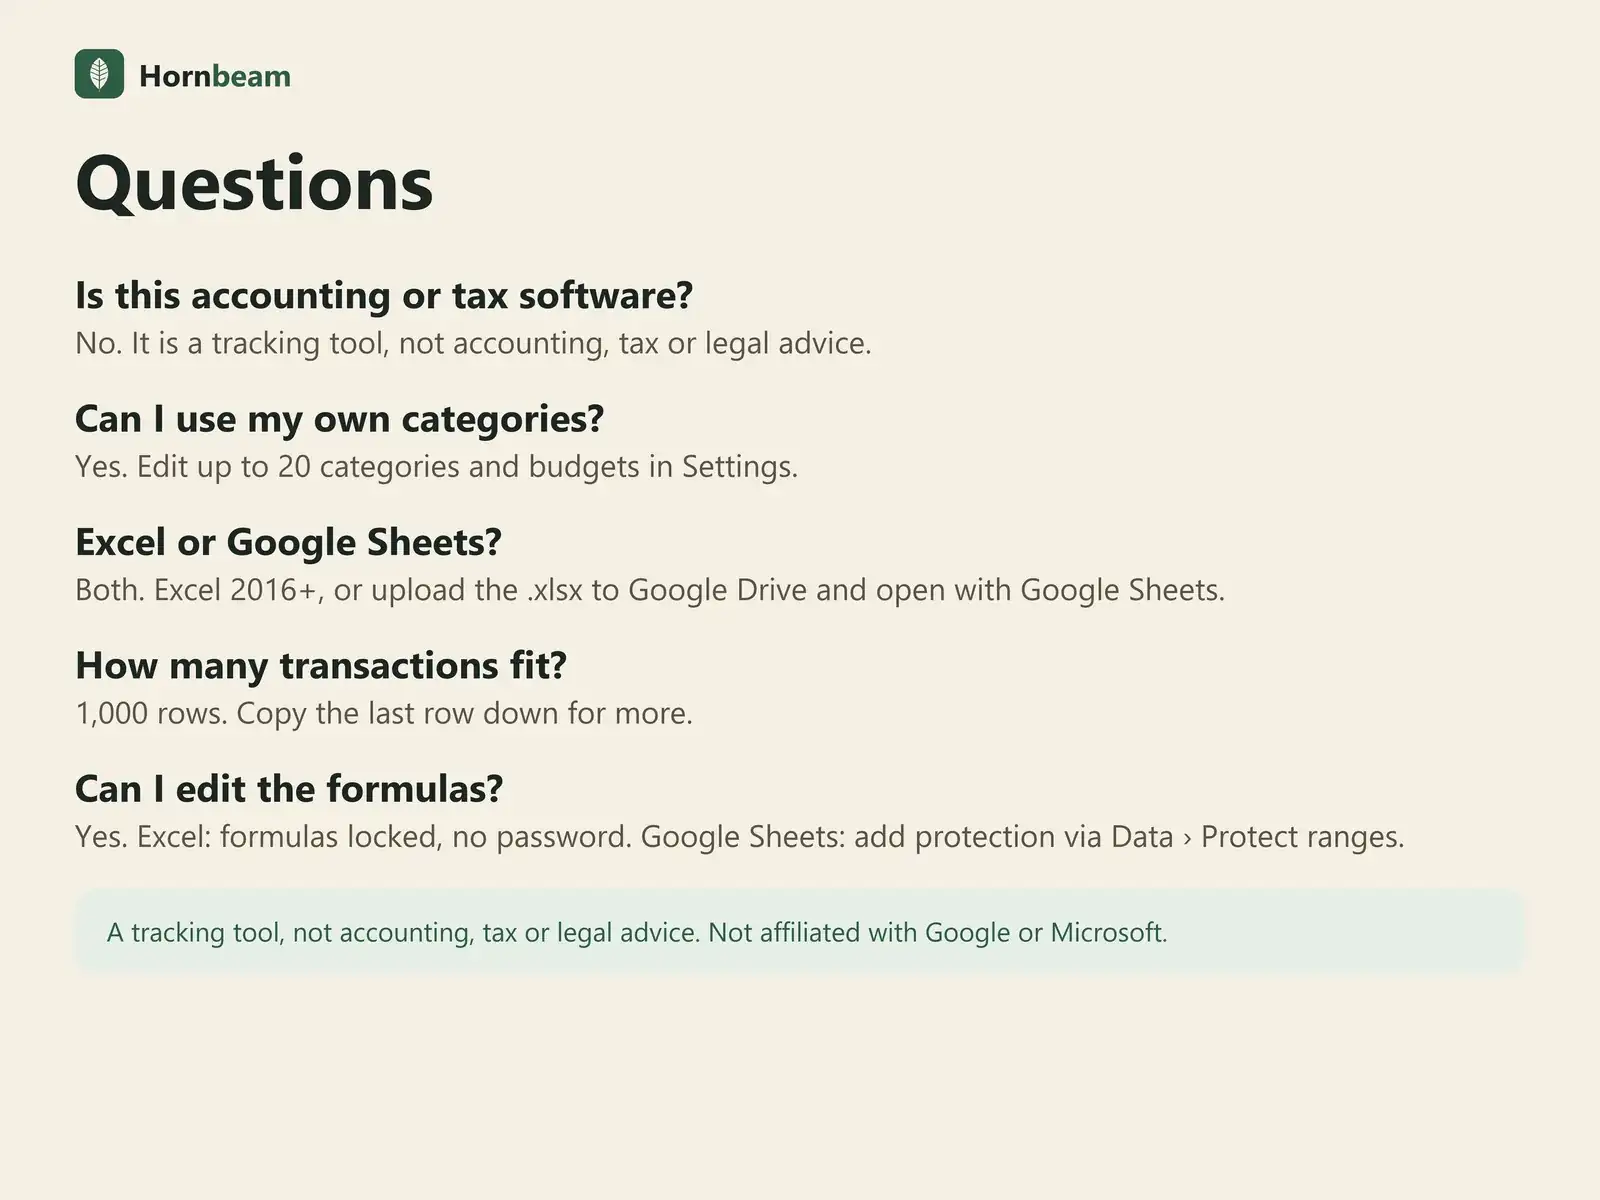
Is this accounting or tax software?
No. It is a tracking tool, not accounting, tax or legal advice.
Can I use my own categories?
Yes. Edit up to 20 categories and budgets in Settings.
Excel or Google Sheets?
Both. Excel 2016+, or upload the .xlsx to Google Drive and open with Google Sheets.
How many transactions fit?
1,000 rows. Copy the last row down for more.
Can I edit the formulas?
Yes. Excel: formulas locked, no password. Google Sheets: add protection via Data › Protect ranges.
Is there a subscription?
No. It is a one-time payment, with free updates for this version.
Can I use it for my clients' work?
Yes. Use it to run your own business, including work you do for clients. Please do not resell or share the files.
How do payment, receipts and refunds work?
Checkout is handled by Polar, our merchant of record, which also issues your receipt. For refunds, Polar's terms apply. If a file does not work, we will fix it or refund you.
Get the Expense & Profit Tracker.
One-time payment, instant download. A tracking tool, not accounting, tax, legal or financial advice.